Stochastic RSI w/ Crossover Alerts (by WJ)NOTE:
// STOCH RSI CODE TAKEN FROM DEFAULT INDICATOR
// I HAVE ONLY MADE SOME ADJUSTMENTS FOR VISUAL AID
// I MADE THIS FOR MY OWN USE BUT HAVE DECIDED TO PUBLISH AND SHARE IN CASE ANYBODY WANTS TO USE IT
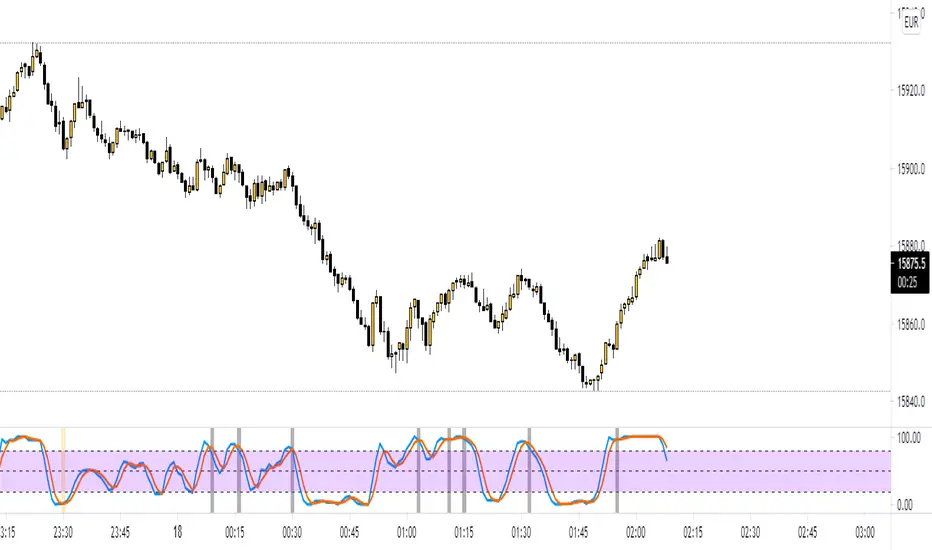
This is the normal default built-in Stochastic RSI indicator which I have added some stuff for visual aid:
Added middle line (50)
Stoch RSI background turns green when K line crosses D line UPWARDS, K line is below the 50 level, and price is above 200 EMA
Stoch RSI background turns red when K line crosses D line DOWNWARDS, K line is above the 50 level, and price is below 200 EMA
Alert notification on the crossover candle with background colour change conditions met
Cerca negli script per "STOCH RSI"
BK AK-9I am incredibly proud to introduce my fourth indicator to the TradingView community:
BK AK-9 — a next-level momentum-volatility hybrid, built for traders who demand precision.
🔥 Why “AK-9”? The Meaning Behind the Name
This indicator is deeply personal to me.
The “AK” in the name represents the initials of my mentor — the man whose guidance shaped my journey in trading, discipline, and strategy.
His wisdom is woven into every line of code, every design choice, and every purpose behind this tool.
The “9” holds its own powerful meaning:
9 is the number of completion and breakthrough — the moment where preparation meets opportunity.
The AK-9 weapon itself is a suppressed variant of the legendary AK platform, built for stealth, precision, and maximum impact in close-quarters combat.
It’s quiet, adaptive, and deadly effective — just like this indicator cuts through market noise, adapts to volatility, and pinpoints moments of maximum opportunity.
✨ About the BK AK-9 Indicator
The BK AK-9 is not just an oscillator.
It’s a multi-layered trading weapon combining:
✅ RSI → Stochastic → Bollinger Bands on Stoch RSI → momentum measured inside volatility.
✅ Dynamic or Static Background Flash → when extremes hit, you get instant visual alerts.
✅ Color-coded %K zones →
🔴 Red: oversold
🟢 Green: overbought
🔵 Blue: neutral
✅ Volatility-adaptive bands → instead of relying on static levels, the bands expand and contract dynamically using standard deviation.
🛡️ Why This Indicator Matters
Pinpoints exhaustion zones statistically, not emotionally.
Confirms breakouts with volatility evidence, not just price action.
Filters noise and helps you wait for high-probability setups.
Gives you visual edge with color-coded momentum and background flash.
Perfect for:
🔹 Breakout traders confirming momentum surges.
🔹 Mean-reversion traders catching exhaustion pivots.
🔹 Swing traders using multi-layered momentum analysis.
🔹 Momentum traders hunting volatility-backed entries.
💥 How to Use BK AK-9
Breakout Confirmation → when Stoch RSI breaks above upper Bollinger Band (green zone, flash ON), ride the trend.
Mean Reversion Trades → when Stoch RSI drops below lower Bollinger Band (red zone, flash ON), look for reversals.
Noise Filtering → stay patient inside the blue zone, wait for extremes.
Advanced Sync → align it with Gann levels, harmonic patterns, Fibonacci clusters, or Elliott waves for maximum edge.
🙏 Final Thoughts
This isn’t just another tool — it’s a weapon in your trading arsenal.
🔹 Dedicated to my mentor, A.K., whose wisdom and legacy guide my work.
🔹 Designed around the number 9, the number of completion, transition, and breakthrough.
🔹 Built to help traders act with precision, discipline, and clarity.
But above all, I give praise and glory to Gd — the true source of wisdom, insight, and success.
Markets will test your patience and your skill, but faith tests your soul. Through every challenge, every victory, and every setback, Gd remains the constant.
This tool is simply another way to use the gifts He has given — to help others rise.
⚡ Stay Ready, Stay Sharp
The markets are a battlefield. But with the right tools, the right strategy, and the right mindset — you will always stay 10 steps ahead.
🔥 Stay locked. Stay loaded. Trade with precision. 🔥
Gd bless, and may He guide us all to wisdom and success. 🙏

Stochastic RSI - DurbtradeDurbtrade Stoch RSI -
1) Stoch RSI
A) The K line can be customized to change color based on vertical direction.
B) The space between K line and D line can be filled with a color depending on whether K line is above or below the D line.
C) There are color-coded, cross-over and cross-under background fills, to signal when the K line crosses the D line.
D) K line is drawn in front of D line (D line is drawn behind K line).
E) Default values : K = 3, D = 4, RSI Length = 14, Stoch Length = 14
2) Horizontal Lines
A) Horizontal lines can be drawn automatically, so you don't have to draw them, and they don't extend past the current bar.
B) There are 11 customizable horizontal lines,
and each line is set to non-customizable increments (zero, 10, 20, 30, 40, fifty, 60, 70, 80, 90, hundred).
C) The 11 lines are divided into 2 groups:
a) 4 PAIRS of lines WITH fill options (10/90, 20/80, 30/70, 40/60... 8 lines total), and
b) 3 INDIVIDUAL lines WITHOUT fill options (zero, fifty, hundred).
D) The 4 fills give you the option to fill the space between each pair with a customizable color and opacity,
regardless of whether the lines themselves are drawn or not.
(all default values are what I feel work best for this indicator...
and initially, only the zero, fifty, and hundred lines are drawn automatically .
You may add the other lines if you choose to, by adjusting the opacity to your liking).
3) Conclusion
A) As with my previous indicators, this one maximizes information, color, discernment, clarity, and customization.
B) It is optimized for your ability to be able to easily customize the indicator according to your preferences...
for use on your own personal television, laptop, or cellular phone screen setup... and on all chart zoom levels and layouts.
C) Please feel free to comment your thoughts, critiques, or suggestions. They are all helpful!
D) Check out my previous pine script indicators if you like this one. They work really well together.
E) I hope that you find this script useful.
F) Enjoy!
//Durbtrade

Chart OscillatorI present you the chart oscillator where an oscillator (Stoch or RSI) is plotted
on the chart itself (instead of below the chart)
It is inspired on an idea of @Kablamicus
Instead of having the lines between 0 and 100, here the '0-100' are
- lowest(low, len)
- highest(high, len)
An overbought/oversold and a middle line is derived from these lines
and the oscillator goes in between.
It resembles very much the 'normal' oscillator, with a few extra's:
- you can see the movement of the candles against the oscillator
- S/R levels of oscillator, 50 line, overbought/oversold line, 0-100 line
Stoch:
RSI:
Also a table is included with the Stoch/RSI values
Cheers!

[fikira] MACD & RSI+Stoch + DivergencesThis is a new version of my "Divergences"
Compared to my "Divergences (Pivots)", this is calculated totally different
There are 3 options:
- MACD
- RSI
- Stoch RSI
Since this script is very heavy in calculation it is limited in time (= inspired from a script of "Che_Trader")
Also it uses "max_bars_back" (=1000)
For MACD and Stoch RSI there is a "custom Divergences Period", which compares more then 7 Pivot Points,
the higher the number, the less reliable, it is not necessary to use this, but it is there,
also you can change the "leftbars" and "rightbars", again, it is not necessary to change, but you can...
Linewidth and style of the Divergences lines can be changed
Thank you!

RF+ Divergence Scalping SystemRF+ Divergence Scalping System + Custom Signals + Alerts.
This chart overlay indicator has been developed for the low timeframe divergence scalper.
Built upon the realtime divergence drawing code from the Divergence for Many indicator originally authored by Lonsometheblue, this chart overlay indicator bundles several additional unique features and modifications to serve as an all-in-one divergence scalping system. The current key features at the time of publishing are listed below (features are optional and can be enabled or disabled):
- Fully configurable realtime divergence drawing and alerting feature that can draw divergences directly on the chart using data sourced from up to 11 oscillators selected by the user, which have been included specifically for their ability to detect divergences, including oscillators not presently included in the original Divergence for Many indicator, such as the Ultimate Oscillator and TSI.
- Optional on chart table showing a summary of key statuses of various indicators, and nearby divergences.
- 2 x Range Filters with custom settings used for low timeframe trend detection.
- 3 x configurable multi-timeframe Stochastic RSI overbought and oversold signals with presentation options.
- On-chart pivot points drawn automatically.
- Automatically adjusted pivot period for up to 4 configurable time frames to fine tune divergences drawn for optimal divergence detection.
- Real-price line for use with Heikin Ashi candles, with styling options.
- Real-price close dots for use with Heikin Ashi candles, with styling options.
- A selection of custom signals that can be printed on-chart and alerted.
- Sessions indicator for the London, New York, Tokyo and Sydney trading sessions, including daylight savings toggle, and unique ‘invert background color’ option, which colours the entire chart - except the trading session you have selected, leaving your chart clear of distracting background color.
- Up to 4 fully configurable moving averages.
- Additional configurable settings for numerous built in indicators, allowing you to alter the lengths and source types, including the UO, TSI, MFI, TSV, 2 x Range Filters.
- Configurable RSI Trend detection signal filter used in a number of the signals, which filters buy signals where the RSI is over the RSI moving average, and only prints sell signals where RSI is under the moving average.
- Customisable on-chart watermark, with inputs for a custom title, subtitle, and also an optional symbol | timeframe | date feature.
The Oscillators able to be selected for use in drawing divergences at the time of publishing are as follows:
- Ultimate Oscillator (UO)
- True Strength Indicator (TSI)
- Money Flow Index (MFI)
- Cumulative Delta Volume (CDV)
- Time Segmented Volume (TSV)
- Commodity Channel Index (CCI)
- Awesome Oscillator
- Relative Strength Index (RSI)
- Stochastic
- On Balance Volume (OBV)
- MACD Histogram
What are divergences?
Divergence is when the price of an asset is moving in the opposite direction of a technical indicator, such as an oscillator, or is moving contrary to other data. Divergence warns that the current price trend may be weakening, and in some cases may lead to the price changing direction.
There are 4 main types of divergence, which are split into 2 categories;
regular divergences and hidden divergences. Regular divergences indicate possible trend reversals, and hidden divergences indicate possible trend continuation.
Regular bullish divergence: An indication of a potential trend reversal, from the current downtrend, to an uptrend.
Regular bearish divergence: An indication of a potential trend reversal, from the current uptrend, to a downtrend.
Hidden bullish divergence: An indication of a potential uptrend continuation.
Hidden bearish divergence: An indication of a potential downtrend continuation.
Setting alerts.
With this indicator you can set alerts to notify you when any/all of the above types of divergences occur, on any chart timeframe you choose, also when the triple timeframe Stochastic RSI overbought and oversold confluences occur, as well as when custom signals are printed.
Configurable pivot period values.
You can adjust the default pivot period values to suit your prefered trading style and timeframe. If you like to trade a shorter time frame, lowering the default lookback values will make the divergences drawn more sensitive to short term price action. By default, this indicator has enabled the automatic adjustment of the pivot periods for 4 configurable time frames, in a bid to optimize the divergences drawn when the indicator is loaded onto any of the 4 time frames selected. These time frames and their associated pivot periods can be fully reconfigured within the settings menu. By default, these have been further optimized for the low timeframe scalper trading on the 1-15 minute time frames.
How do traders use divergences in their trading?
A divergence is considered a leading indicator in technical analysis , meaning it has the ability to indicate a potential price move in the short term future.
Hidden bullish and hidden bearish divergences, which indicate a potential continuation of the current trend are sometimes considered a good place for traders to begin, since trend continuation occurs more frequently than reversals, or trend changes.
When trading regular bullish divergences and regular bearish divergences, which are indications of a trend reversal, the probability of it doing so may increase when these occur at a strong support or resistance level . A common mistake new traders make is to get into a regular divergence trade too early, assuming it will immediately reverse, but these can continue to form for some time before the trend eventually changes, by using forms of support or resistance as an added confluence, such as when price reaches a moving average, the success rate when trading these patterns may increase.
Typically, traders will manually draw lines across the swing highs and swing lows of both the price chart and the oscillator to see whether they appear to present a divergence, this indicator will draw them for you, quickly and clearly, and can notify you when they occur.
How do traders use overbought and oversold levels in their trading?
The oversold level is when the Stochastic RSI is above the 80 level is typically interpreted as being 'overbought', and below the 20 level is typically considered 'oversold'. Traders will often use the Stochastic RSI at, or crossing down from an overbought level as a confluence for entry into a short position, and the Stochastic RSI at, or crossing up from an oversold level as a confluence for an entry into a long position. These levels do not mean that price will necessarily reverse at those levels in a reliable way, however. This is why this version of the Stoch RSI employs the triple timeframe overbought and oversold confluence, in an attempt to add a more confluence and reliability to this usage of the Stoch RSI.
This indicator is intended for use in conjunction with related panel indicators including the TSI+ (True Strength Indicator + Realtime Divergences), UO+ (Ultimate Oscillator + Realtime Divergences), and optionally the STRSI+ (MTF Stochastic RSI + Realtime Divergences) and MFI+ (Money Flow Index + Realtime Divergences) available via this authors’ Tradingview profile, under the scripts section. The realtime divergence drawing code will not identify all divergences, so it is suggested that you also have panel indicators to observe. Each panel indicator also offers additional means of entry confirmation into divergence trades, for example, the Stochastic can indicate when it is crossing down from overbought or up from oversold, the TSi can indicate when the 2 TSI bands cross over one another upward or downward, and the UO and MFI can indicate an entry confluence when they are nearing, or crossing their centerlines, for more confidence in your divergence trade entries.
Additional information on the settings for this indicator can be found via the tooltips within the settings menu itself. Further information on feature updates, and usage tips & tricks will be added to the comments section below in due course.
Disclaimer: This indicator uses code adapted from the Divergence for Many v4 indicator authored by Lonesometheblue, and several stock indicators authored by Tradingview. With many thanks.

Multi-timeframe Dashboard for RSI And Stochastic RSI Dashboard to check multi-timeframe RSI and Stochastic RSI on 4h, 8h, 12h, D and W
Great side tool to assist on the best time to buy and sell and asset.
Shows a green arrow on a good buy moment, and a red when to sell, for all timeframes. In case there are confluence on more than one, you have the info that you need.
Uses a formula with a weight of 5 for RSI and 2 for Stochastic RSI, resulting on a factor used to set up a color for each of the timeframes.
Legend per each timeframe:
- Blue: Excellent buy, RSI and Stoch RSI are low
- Green: Great buy, RSI and Stoch RSI with a quite positive entry point
- White: Good buy
- Yellow: A possible sell, depending on combination of timeframes. Not recommended for a buy
- Orange: Good sell, depending on combination of timeframes
- Red: If on more than one timeframe, especially higher ones, it is a good time to sell
For reference (But do your own research):
- Blue on Weekly: Might represent several weeks of growth. Lower timeframes will cycle from blue to red, while daily and Weekly gradually change
- Blue on Daily: Might represent 7-15 days of growth, depending on general resistance and how strongly is the weekly
PS: Check the RSI, Stochastic RSI and other indicators directly as well

Kitchen [ilovealgotrading]
OVERVIEW:
Kitchen is a strategy that aims to trade in the direction of the trend by using supertrend and stochRsi data by calculating at different time values.
IMPLEMENTATION DETAILS – SETTINGS:
First of all, let's understand the supertrend and stocrsi indicators.
How do you read and use Super Trend for trading ?
The price is often going upwards when it breaks the super trend line while keeping its position above the indication level.
When the market is in a bullish trend, the indicator becomes green. The indicator level will act as trendline support in such a scenario. The color of the indicator changes to red to indicate a negative trend once the price crosses the support line. The price uses the super trend level as a trendline resistance during a bearish move.
In our strategy, if our 1-hour and 4-hour supertrend lines show the up or down train in the same direction at the same time, we can assume that a train is forming here.
Why do I use the time of 1 hour and 4 hours ?
When I did a backtest from the past to the present, I discovered that the most accurate and consistent time zones are the 1 hour and 4 hour time zones.
By the way we can change our short term timeframe(1H) and long term timeframe(4H) from settings panel.
How do you read and use the Stoch-RSI Indicator?
This indicator analyzes price dynamics automatically to detect overbought and oversold locations.
The indicator includes:
- The primary line, which typically has values between 0 and 100;
- Two dynamic levels for overbought and oversold conditions.
IF our stoch-rsi indicator value has fallen below our lower boundary line, the oversold event has been observed in the price, if our stoch-rsi value breaks up our bottom line after becoming oversold, we think that the price will start the recovery phase.(The case is also true for the opposite.)
However, this does not always apply and we need additional approvals, Therefore, our 1H and 4H supertrrend indicator provides us with additional confirmation.
Buy Condition:
Our 1H(short term) and 4H(long term) supertrrend indicator, has given the buy signal(green line and yellow line), and if our stochrsi indicator has broken our oversold line up on the past 15 bars, the buy signal is formed here.
Sell Condition:
Our 1H(short term) and 4H(long term) supertrrend indicator, has given the sell signal(red line and orange line), and if our stochrsi indicator has broken our overbuy line down on the past 15 bars, the sell signal is formed here.
Stop Loss or Take Profit Conditions:
Exit Long Senerio:
All conditions are completed, the buy signal has arrived and we have entered a LONG trade, the 1-hour supertrend line follows the price rise(yellow line), if the price breaks below the 1-hour super trend line and a sell condition occurs for 1H timeframe for supertrend indcator, LONG trade will exit here.
Exit Short Senerio:
All conditions are completed, the Sell signal has arrived and we have entered a SHORT trade, the 1-hour supertrend line follows the price down(orange line), if the price breaks up the 1-hour super trend line and a buy condition occurs for 1H timeframe for supertrend indcator, SHORT trade will exit here.
What can you change in the settings panel?
1-We can set Start and End date for backtest and future alarms
2-We can set ATR length and Factor for supertrend indicator
3-We can set our short term and long term timeframe value
4-We can set StochRsi Up and Low limit to confirm buy and sell conditions
5-We can set stochrsi retroactive approval length
6-We can set stochrsi values or the length
7-We can set Dollar cost for per position
8- We can choose the direction of our positions, we can set only LONG, only SHORT or both directions.
9-IF you want to place automatic buy and sell orders with this strategy, you can paste your codes into the Long open-close or Short open-close message sections.
For example
IF you write your alert window this code {{strategy.order.alert_message}}.
When trigger Long signal you will get dynamically what you pasted here for Long Open Message
ALSO:
Please do not open trades without properly managing your risk and psychology!!!
If you have any ideas what to add to my work to add more sources or make calculations cooler, suggest in DM .

[GJ]IFRSITHE INVERSE FISHER TRANSFORM STOCH RSI
HOW IT WORKS
This indicator uses the inverse fisher transform on the stoch RSI for clear buying and selling signals. The stoch rsi is used to limit it in the range of 0 and 100. We subtract 50 from this to get it into the range of -50 to +50 and multiply by .1 to get it in the range of -5 to +5. We then use the 9 period weighted MA to remove some "random" trade signals before we finally use the inverse fisher transform to get the output between -1 and +1
HOW TO USE
Buy when the indicator crosses over –0.5 or crosses over +0.5 if it has not previously crossed over –0.5.
Sell when the indicator crosses under +0.5 or crosses under –0.5 if it has not previously crossed under +0.5.
We can see multiple examples of good buy and sell signals from this indicator on the attached chart for QCOM. Let me know if you have any suggestions or thoughts!

MACD Trend CandlesThe script combines 2 indicators (MACD and Stoch-RSI) and puts them visually directly on the candles - can be used with normal OHLC candles or Heiken Ashi candles. Furthermore, you can derive divergences exremely easy directly visually from the candles as well. Lastly, a SMA 20 high and a SMA 20 low line build a trend channel.
Script is best used in trending markets to trade with the trend.
1) SMA trend channel:
* uptrend: close above
* downtrend: close below
* aggressive entry (uptrend) closing inside channel from below
* conservative entry (uptrend) closing above channel from inside
* hold (uptrend) until close below channel
* can be used accordingly for the downtrend
2) MACD candles
* visualization of the MACD histogram directly on the candles
* dark blue: histogram > 0 and histogram > histogram of previous candle
* light blue: histogram > 0 and histogram < histogram of previous candle
* orange: histogram < 0 and histogram < histogram of previous candle
* light blue: histogram < 0 and histogram > histogram of previous candle
* hold uptrend (dark/light blue candles) - combined with trend channel (above channel)
* hold downtrend (orange /yellow candles) - combined with trend channel (below channel)
* Color divergence: light blue candle > dark blue candle (price and MACD show divergence (bearish)
* Color divergence: yellow candle < orange candle (price and MACD show divergence (bullish)
* Trend change (0 line cross to upside) yellow or orange to dark blue
* Trend change (0 line cross to downside) dark or light blue to orange
3) Stoch RSI diamonds
* visualization of the STOCH-RSI as diamonds above or below the candle
* k, d line > 80: diamond above the candle
* k, d line < 20: diamond below the candle
* divergence caldle without diamond above > candle with diamond above (bearish divergence)
* divergence caldle without diamond below < candle with diamond below (bullish divergence)
Feel free to test each part individually and combine it with other indicators, e.g. BBands and Ichimoku Cloud - you will see it is a powerful visualization script
HAVE FUN

PIP HUNTERSCR STOCH RSI SIGNALScript made in combination of Stoch and RSI, made by and for PIPHUNTERS on 03/10/2019
Stoch default values 10-3-3 higher band level 90, lower band level 10
RSI default value 14 color:blue

TrendShift [MOT]📈 TrendShift – Multi-Factor Momentum & Trend Signal Suite
TrendShift is a precision-built momentum and confluence tool designed to highlight directional shifts in price action. It combines EMA slope structure, oscillator confirmation, volume behavior, and dynamic SL/TP logic into one cohesive system. Whether you're trading with the trend or catching reversals, TrendShift provides data-backed clarity and visual confidence — and it’s available free to the public.
🔍 Core Signal Logic
Buy (🟢 Long) and Sell (🔴 Short) signals are triggered when multiple conditions align within a set bar window (default: 5 bars):
Stochastic RSI K/D cross
RSI crosses above 20 (long) or below 80 (short)
Stochastic RSI breaks 20 (long) or 80 (short)
Volume exceeds 20-bar average
🧭 Visual Trend Dashboard – Signal Table
A real-time on-chart dashboard displays:
EMA Trend: Bullish / Bearish / Mixed (based on 4 EMA slopes)
Stoch RSI: Oversold / Overbought / Neutral
RSI: Exact value with zone label
Volume: Above or Below average
Dashboard theme and position are fully customizable.
📐 Trend Structure with EMA Slope Logic
Plots four EMAs (21, 50, 100, 200) color-coded by slope:
Green = Rising
Red = Falling
These feed into the dashboard's EMA Trend display.
🎯 Optional Take Profit / Stop Loss Zones
When enabled, SL/TP lines plot automatically on valid signals:
Fixed-distance targets (e.g., 10pt TP, 5pt SL)
Auto-remove on TP or SL hit
Separate lines for long vs. short trades
Fully customizable styling
🔁 Trailing Stop Filter (Internal Logic)
A custom ATR-based trailing stop helps validate directional strength:
ATR period
HHV window
ATR multiplier
Used internally — not plotted — to confirm trend progression before entry.
⚙️ Customizable Parameters
Every core component is user-configurable:
EMA periods: 21 / 50 / 100 / 200
ATR trailing logic: period, HHV, multiplier
Oscillator settings: Stoch RSI & RSI
Volume length
SL/TP toggles and point values
Bar clustering window
Dashboard theme and location
🔔 Alerts Included
BUY Signal Triggered
SELL Signal Triggered
Compatible with webhook automation or mobile push notifications.
⚠️ Disclaimer
This tool is for educational purposes only and is not financial advice. Trading involves risk — always do your own research and consult a licensed professional before making trading decisions.

AP IFTCCIv2/IFTStoch/IFTRSI Multi-TimeframeMulti-Timeframe IFT-CCI/Stoch/RSI Composite
This enhanced indicator combines three powerful oscillators—Inverse Fisher Transform (IFT) versions of the Commodity Channel Index (CCI), Stochastic, and Relative Strength Index (RSI)—into a unified multi-timeframe analysis tool. Originally developed by John Ehlers (pioneer of cyclical analysis and signal processing in trading systems) and adapted by KIVANC (@fr3762), this version adds dual-timeframe capability to compare indicator values across different chart resolutions.
Key Features:
Triple Oscillator Composite
IFT-CCI: Smoothed CCI values transformed via Ehlers' Inverse Fisher Transform (blue-gold)
IFT-Stochastic: Classic stochastic oscillator processed through IFT (blue)
IFT-RSI: RSI oscillator converted to IFT format (magenta)
Composite Average Line: Combined average of all three indicators (green)
Multi-Timeframe Analysis
Compare primary and secondary timeframes (e.g., 1H vs. 4H, daily vs. weekly)
Primary timeframe plots use solid lines with 80% opacity
Secondary timeframe (optional) uses dashed/circle markers with 40% opacity
Key Levels
Overbought (+0.75) and oversold (-0.75) reference lines
Zero-centerline for momentum direction bias
Applications:
Trend Confirmation: Align higher timeframe signals with lower timeframe entries
Divergence Detection: Spot inter-timeframe discrepancies in momentum
Regime Filter: Use higher timeframe composite values to filter trades
Technical Basis:
Inverse Fisher Transform: Compresses oscillator values into bounded (-1 to +1) range while emphasizing extreme moves
Dual WMA Smoothing: Combines initial calculation smoothing (WMA1) with final output smoothing (WMA2)
Exponential Scaling: (e^2x - 1)/(e^2x + 1) formula converts Gaussian-like distributions to bounded outputs
Credits:
Original Concept: John Ehlers (IFT methodology, cyclical analysis foundations)
Initial Implementation: KIVANC (@fr3762 on Twitter) for the base IFT-CCI/Stoch/RSI script
Multi-Timeframe Adaptation: for cross-resolution analysis capabilities
This tool is particularly effective for traders seeking to align multiple timeframes while using Ehlers' noise-reduction techniques. The composite average line provides a consensus view, while the individual oscillators help identify component strength/weakness.

Stochastic MFIDue to some similarity of the Relative Strength Index(RSI) and Money Flow Index(MFI), I thought of creating a Stoch MFI inspired by the Stoch RSI.
- can be used similar to the Stoch RSI
- useful for pullback during trending markets and for S&R trading during ranging markets
TAYOR!

Stoch MOM + Stoch RSIScript based on orginal Stochastic RSI, only added extra stoch MOM, nothing more.

Super StochThis is a multi-time frame Stoch RSI based on Chris Moody's "CM_Stochastic_MTF". Changes are primarily cosmetic and the "stock" signal and Stoch RSI calculations are retained.

RSI / Stoch / Stoch RSI (SRSI) Overlay [SigmaDraconis]Combines RSI, Stochastic and Stochastic RSI (SRSI) in only one indicator.
Most useful to better pick tops and bottoms on oversold and overbought levels.
I decided to write it since I felt the need to look at how all 3 behaved at once, relative to each.
If you like it, here are my tip jars:
BTC: 1CfBVcxmrx7Uxw3SYJWVGKZsEK698fwXP9
LTC: LXXt76wWTksLcM5qbbiAxfP1o8SoxwzDH2
BTS: sigma-draconis

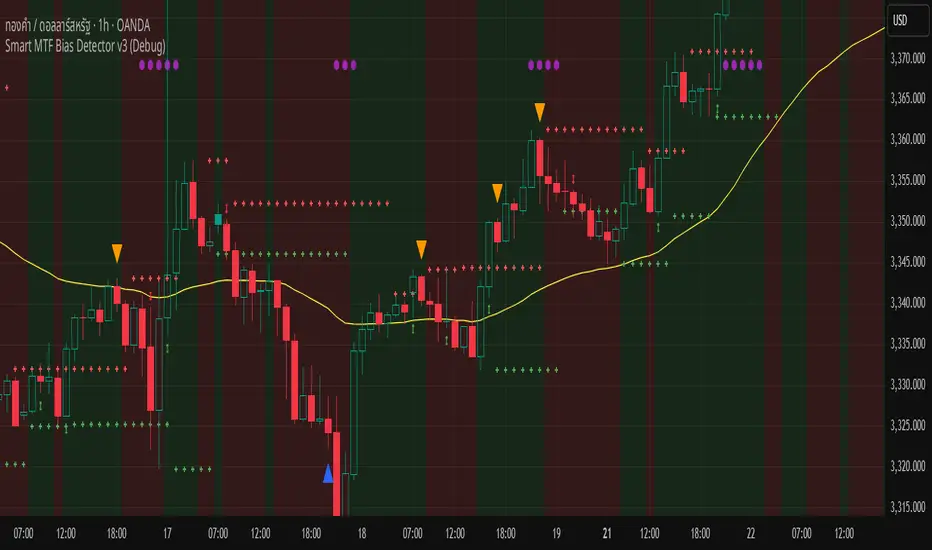
Smart MTF Bias Detector v3 (Debug)Here's a breakdown of the "Smart MTF Bias Detector v3 (Debug)" indicator's five main filters:
Main Trend (Multi-Timeframe Heikin Ashi)
The green/red background indicates the trend from Heikin Ashi candles on the H1 timeframe (or your set timeframe).
If the Heikin Ashi candle closes above its open, the background is green (indicating an upward bias).
If the Heikin Ashi candle closes below its open, the background is red (indicating a downward bias).
Short-Term Trend Filter (EMA50)
The yellow line represents the EMA50.
Buy only when the price closes above the EMA50.
Sell only when the price closes below the EMA50.
Abnormal Buy/Sell Pressure Detection (Volume Spike)
Purple dots signify candles where the volume is greater than the SMA (Simple Moving Average) of volume over N previous candles, multiplied by a specified multiplier.
This confirms there's "force" driving the price up or serious selling pressure.
Momentum Filter (Stochastic RSI)
Blue upward triangles and orange downward triangles indicate when %K crosses %D.
It uses Oversold/Overbought targets (20/80) to avoid crosses in the middle ranges.
Pivot Break (Fractal Breakout)
Red "X" marks represent Fractal Highs, and green "X" marks represent Fractal Lows.
Red/green up/down arrows indicate breakouts of these levels (e.g., a previous High being broken means an upward breakout, or a previous Low being broken means a downward breakout).
BUY Signal Conditions
A BUY signal will be generated when:
The background is green (HTF Trend ↑).
The Stoch RSI crosses up from below the Oversold zone (blue arrow).
A Fractal Low breakout occurs (Fract UP arrow).
The price is above the EMA50.
There is a Volume Spike (purple dot).
SELL Signal Conditions
A SELL signal will be generated when:
The background is red (HTF Trend ↓).
The Stoch RSI crosses down from above the Overbought zone (orange arrow).
A Fractal High breakout occurs (Fract DOWN arrow).
The price is below the EMA50.
There is a Volume Spike (purple dot).
Oscillators Overlay w/ Divergencies/Alerts by DGTAn oscillator is a technical analysis tool that, simply said, gauge momentum, determine market trend direction and duration. For some oscillators, fluctuations are bounded by some upper and lower band, and traders use them to discover short-term overbought or oversold conditions.
Oscillators are often combined with moving average indicators to signal trend breakouts or reversals
Histogram, is the difference between the oscillator and signal lines, which oscillates above and below a center line and is used as a good indication of an asset's momentum
What to look for
- Signal Line Crossover is the most common signal produced by the oscillators
- Zero Line Crossovers have a very similar premise to Signal Line Crossovers
- Divergence , when the oscillator and actual price are not in agreement, is another signal created by the oscillators
- Overbought and Oversold , with any range-bound oscillator, conditions are a primary signal generated
Oscillators Overlay study
* Presents oscillators on top of the mian chart (price chart)
* A single indicator for many well known and custom oscillators
* Divergence detection
* Alerts for various condtions
The list of oscillators included;
- Awesome Oscillator (AO)
- Chaikin Oscillator (Chaikin Osc)
- Commodity Channel Index (CCI)
- Distance Oscillator
- Elder-Ray Bear and Bull Power
- Elliott Wave Oscillator (EWO)
- Klinger Oscillator
- Money Flow Index (MFI)
- Moving Average Convergence Divergence (MACD)
- Rate Of Change (ROC)
- Relative Strength Index (RSI)
- Stochastic (Stoch)
- Stochastic RSI (Stoch RSI)
- Volume Oscillator (Volume Osc)
- Wave Trend
In technical analysis, investors find oscillators to be important technical tools and consider them more effective when used in conjunction with other means of technical analysis
Disclaimer : Trading success is all about following your trading strategy and the indicators should fit within your trading strategy, and not to be traded upon solely
The script is for informational and educational purposes only. Use of the script does not constitutes professional and/or financial advice. You alone the sole responsibility of evaluating the script output and risks associated with the use of the script. In exchange for using the script, you agree not to hold dgtrd TradingView user liable for any possible claim for damages arising from any decision you make based on use of the script

Multiple MACD RSI simple strategySimple strategy script I've had for a while but looks like I never published.
Although it is one of my most simple it seems to have the best profitability. It is pretty rough though. the Stoch RSI has only a little weight to the trade trigger. I'll refine it more over time or you can by all means. Basically the Stoch RSI current K line has to be OVER 40 to trigger a SELL. It has no effect on buy side.
The triggers are roughly as follows:
Year - since so many assets have gone 2x, 3x, 10x+ since 2013 having a strategy that earns a 500% return from 2013 to now isn't that good if buy-and-holding would have got you 800%. This eliminates some of that noise and makes it a little easier to quickly gauge success. So buy/sell trigger need a value of greater or equal to 2018 (default)
MACD 1 - First MACD (short) needs to indicate greater than 0 to buy or less than 0 to sell.
MACD 2 - Same as MACD1 but for second MACD set (long)
Uptrend - Latest close + high divided by last periods close + high needs to be grater than 1. So if latest is 34.30 close and 34.60 high and previous interval is 34.80 close and 34.82 high, that is 0.99 and will not trigger a buy trade.
Downtrend - Same thing but close + low and less than 1.
This script/strategy is pretty rough but if there is interest I'll polish it more since it is a pretty solid but simple strategy for most assets.

A Multi 10 indicatorREAD NOTE BEFORE APPLYING or you may think indicator doesnt work.
This indicator is a revise of another i made and contains 10 Optional Indicators allowing you to load more then 3 indicators at once if you so choose and dont pay for the platform!
Hopefully someone will find use for this script besides me :) I dont suggest turning all on at once because it
will not look right. Alot will overlap if you wish but i only use the Session and trend bar at once in
conjuction with a Oscillator setting like MacD , RSI , Stoch , Aroon or CCI .
In the chart you see i only have a few indicators active ENJOY!!
---------- NOTE ----------- ( Everything is OFF by default and indicator SHOULD show up BLANK when loaded) ------------ NOTE -------------
(Can turn EVERYTHING on AND change any values in the format tab once indicator loads)
Indicators included are listed below
Sessions, including, NY session, Aussie session, Asian session, and Europe market sessions.
MacD Split Colored , aroon oscillator
CCI Oscillator , classic aroon
RSI Oscillator , Elliot wave
Stoch RSI Oscillator , ATR%
My own Trend bar
---------- NOTE ----------- ( Everything is OFF by default and indicator SHOULD show up BLANK when loaded) ------------ NOTE -------------
(Can turn EVERYTHING on AND change any values in the format tab once indicator loads) CODE probably looks messey but this is something i made for me so i didnt really care lol
A Multi 10 indicatorREAD NOTE BEFORE APPLYING or you may think indicator doesnt work.
This indicator is a revise of another i made and contains 10 Optional Indicators allowing you to load more then 3 indicators at once if you so choose and dont pay for the platform!
Hopefully someone will find use for this script besides me :) I dont suggest turning all on at once because it
will not look right. Alot will overlap if you wish but i only use the Session and trend bar at once in
conjuction with a Oscillator setting like MacD , RSI , Stoch , Aroon or CCI .
In the chart you see i only have a few indicators active ENJOY!!
---------- NOTE ----------- ( Everything is OFF by default and indicator SHOULD show up BLANK when loaded) ------------ NOTE -------------
(Can turn EVERYTHING on AND change any values in the format tab once indicator loads)
NY session, Aussie session, Asian session, and Europe market sessions.
MacD Split Colored , aroon oscillator
CCI Oscillator , classic aroon
RSI Oscillator , Elliot wave
Stoch RSI Oscillator
Aroon Oscillator
My own Trend bar
---------- NOTE ----------- ( Everything is OFF by default and indicator SHOULD show up BLANK when loaded) ------------ NOTE -------------
(Can turn EVERYTHING on AND change any values in the format tab once indicator loads) CODE probably looks messey but this is something i made for me so i didnt really care lol
